
XRF Data Analysis: Spectroscopy Results Processing
Understanding XRF Spectroscopy Data
XRF spectroscopy generates data in the form of energy spectra—graphs plotting X-ray intensity against energy levels. When the analyzer's detector measures fluorescent X-rays emitted from a sample, it records both the energy of each detected photon and the number of photons at each energy level. This creates a characteristic spectrum with peaks at specific energies corresponding to elements present in the sample.
Each element produces peaks at fixed, known energy positions. Copper generates its characteristic Kα peak at 8.04 keV, iron at 6.40 keV, chromium at 5.41 keV, and so forth. These energy positions serve as elemental fingerprints, allowing unambiguous identification of which elements exist in the sample. The intensity (height and area) of each peak correlates directly with the concentration of that element in the analyzed material.
Modern XRF detectors, particularly silicon drift detectors (SDD), achieve energy resolution around 125-140 eV (FWHM - full width at half maximum), enabling clear separation of adjacent elemental peaks in most cases. This resolution determines how well the system can distinguish between elements with closely spaced emission lines, such as lead and bismuth, or arsenic and selenium.
Qualitative Analysis: Element Identification
Peak Recognition and Assignment
Qualitative analysis represents the first stage of XRF data processing, identifying which elements are present without quantifying their concentrations. Modern XRF software automatically compares detected peak positions against comprehensive elemental databases containing known X-ray emission energies for all elements from sodium through uranium.
The software identifies characteristic Kα, Kβ, Lα, Lβ, and Mα lines for each element, matching observed peaks to theoretical positions within the detector's resolution limits. When multiple characteristic lines for an element appear (for example, both Kα and Kβ for iron), this provides confirmation of identification and increases confidence in the analysis.
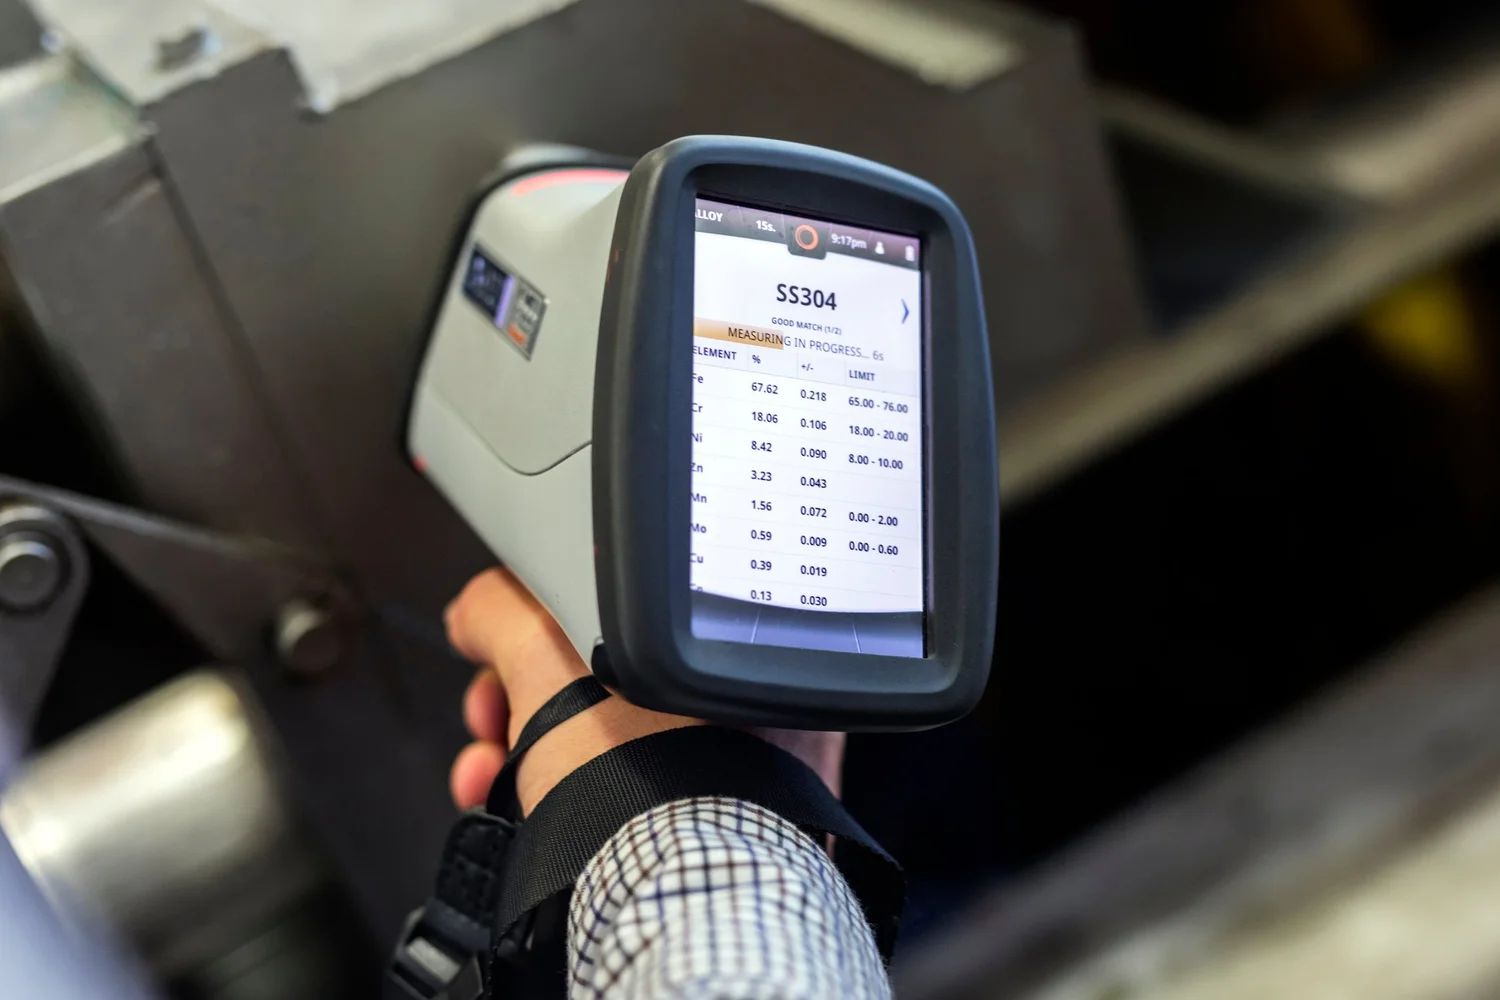
Automated peak identification typically completes within seconds, displaying results as an elemental list showing which elements were detected. This rapid qualitative screening helps analysts understand sample composition before proceeding to detailed quantitative analysis.
Handling Peak Overlaps
Spectral interpretation becomes more complex when emission lines from different elements overlap or appear very close together. For example, titanium Kβ (4.93 keV) overlaps significantly with vanadium Kα (4.95 keV), making separation challenging without excellent detector resolution and sophisticated deconvolution algorithms.
Advanced XRF processing software employs mathematical deconvolution techniques to separate overlapping peaks, fitting multiple Gaussian or Lorentzian functions to the observed spectrum. These algorithms calculate the contribution of each element to the combined peak, enabling accurate identification even in complex multi-element samples.
Understanding which elements commonly cause peak overlaps helps analysts interpret results correctly and recognize when additional confirmatory analysis might be needed.
Quantitative Analysis Methods
Calibration Curve Approach
The calibration curve method establishes relationships between fluorescent X-ray intensity and elemental concentration using certified reference materials (standards) with known compositions. Analysts measure multiple standards spanning the concentration range of interest, plotting intensity versus concentration to create calibration curves for each element.
When analyzing unknown samples, the software compares measured intensities to these calibration curves, calculating elemental concentrations by interpolation. This empirical approach works exceptionally well when analyzing samples similar in composition and matrix to the calibration standards.
Calibration curve methods require maintaining extensive libraries of standards representing different sample types—metals, soils, minerals, ceramics, polymers. The accuracy depends heavily on how well standards match unknowns in both composition and physical form, as matrix effects significantly influence X-ray intensities.
Fundamental Parameters (FP) Method
The fundamental parameters approach represents a more sophisticated quantitative analysis technique based on theoretical calculations of X-ray physics. FP algorithms model the entire measurement process mathematically, accounting for primary X-ray beam characteristics, sample matrix effects, absorption, enhancement, detector efficiency, and geometric factors.
The FP method calculates expected fluorescent intensities based on first principles physics, then iteratively adjusts assumed sample composition until calculated and measured spectra match. This approach requires minimal or no calibration standards, making it highly flexible for analyzing diverse sample types without extensive reference materials.
Modern FP software incorporates comprehensive databases of fundamental atomic parameters—mass absorption coefficients, fluorescent yields, transition probabilities—enabling accurate quantification across the periodic table. The method automatically corrects for matrix effects where one element's presence affects the measured intensity of another through absorption or secondary excitation.
While mathematically complex, FP analysis is largely automated in commercial XRF software, requiring analysts only to specify sample type, measurement conditions, and elements of interest. Results typically appear as weight percentages, atomic percentages, or concentrations in ppm/ppb.
Matrix Effect Corrections
Matrix effects represent one of the most significant challenges in XRF quantitative analysis. These effects occur when elements within the sample absorb fluorescent X-rays from other elements (absorption effects) or when fluorescent X-rays from one element excite additional fluorescence from another (enhancement effects).
For example, in stainless steel analysis, iron's Kα X-rays can excite chromium atoms, producing additional chromium fluorescence beyond that caused by the primary X-ray beam. This enhancement makes chromium appear more concentrated than it actually is unless proper corrections are applied.
Conversely, heavy elements like lead strongly absorb X-rays from lighter elements, reducing their measured intensities and making them appear less concentrated. High-quality XRF data processing software automatically calculates and applies these corrections using either influence coefficient methods (empirical corrections derived from standards) or fundamental parameter calculations (theoretical corrections based on absorption coefficients and geometric factors).
Proper matrix correction is essential for accurate quantification, particularly in complex multi-element samples where multiple interaction pathways exist. The accuracy of final results depends heavily on how well the software models and corrects for these effects.
Spectral Processing Steps
Background Subtraction
XRF spectra contain continuous background signals arising from scattered primary X-rays (Rayleigh and Compton scattering) and detector noise. Before accurate peak integration can occur, this background must be modeled and subtracted from the spectrum.
Software algorithms fit polynomial functions or other mathematical models to regions between characteristic peaks, estimating background contribution across the entire spectrum. Subtracting this calculated background leaves only the characteristic elemental peaks for integration and quantification.
Proper background modeling significantly improves detection limits and quantification accuracy, especially for trace elements producing small peaks superimposed on significant backgrounds.
Peak Integration and Area Calculation
After background subtraction and peak deconvolution, the software integrates the area under each elemental peak. Peak area (total counts) provides a more accurate measure of elemental concentration than peak height alone, as it accounts for peak broadening and shape variations.
Integration algorithms define peak boundaries, sum all counts within those boundaries after background subtraction, and apply corrections for any peak overlaps. The resulting net peak areas feed into calibration curves or fundamental parameter calculations for final concentration determination.
Statistical uncertainty in peak areas depends on counting statistics—higher total counts produce lower relative uncertainties. Analysis time selection balances the need for statistical precision against measurement speed requirements.
Software Tools for XRF Data Analysis
Commercial Instrument Software
Most XRF manufacturers provide proprietary software packages optimized for their instruments. These integrated solutions handle data acquisition, real-time spectral display, automated peak identification, calibration management, quantitative analysis, and results reporting within unified interfaces.
Commercial software typically includes extensive pre-installed calibrations for common applications—alloy analysis, soil screening, ore analysis, precious metals testing—enabling immediate use without extensive setup. User-friendly graphical interfaces make these tools accessible to operators without specialized spectroscopy backgrounds.
Advanced features in premium software packages include custom calibration development, fundamental parameters modeling with adjustable parameters, statistical tools for data validation, compliance reporting for regulatory requirements, and database integration for quality management systems.
Open-Source Analysis Platforms
For researchers and advanced users requiring customization beyond commercial software capabilities, open-source XRF analysis tools offer powerful alternatives. Platforms like PyMca (Python-based) provide comprehensive spectral processing, batch analysis capabilities, and scripting interfaces for automated workflows.
These tools excel at processing large datasets from XRF imaging systems, applying multivariate statistical analysis techniques like principal component analysis (PCA) for pattern recognition, and implementing custom quantification algorithms. The open-source nature allows modification and extension to support novel analytical approaches.
While requiring more technical expertise than commercial software, open-source platforms offer unmatched flexibility for research applications and method development.
Data Quality and Validation
Statistical Considerations
XRF analysis results include statistical uncertainties arising from counting statistics and calibration errors. Well-designed software reports results with appropriate uncertainty estimates, typically expressed as standard deviations or confidence intervals.
Detection limits—the minimum concentration reliably distinguishable from background—depend on element-specific factors including fluorescent yield, detector efficiency, matrix absorption, and analysis time. Understanding detection limits for elements of interest ensures realistic expectations about what the analysis can and cannot reveal.
Quality Control Practices
Implementing quality control measures validates XRF data quality. Regular analysis of certified reference materials confirms that measured values match known concentrations within acceptable tolerances. Drift monitoring tracks instrument performance over time, detecting calibration shifts that might compromise accuracy.
Replicate measurements of samples assess precision, revealing whether variations result from true sample heterogeneity or analytical uncertainty. Documentation of quality control results supports regulatory compliance and accreditation requirements in many industries.
Best Practices for Accurate Data Processing
Optimize XRF data analysis by selecting appropriate analysis times—longer measurements improve statistics for trace elements, while shorter times suffice for major constituents. Choose calibration approaches matching your application—use matrix-matched standards when available, or fundamental parameters for diverse sample types.
Understand your sample matrix and select software settings accordingly. Homogeneous samples allow simpler analysis, while heterogeneous materials may require multiple measurement points and statistical averaging. Review spectra visually to identify unusual features, artifacts, or potential interferences that automated processing might miss.
Maintain current spectral libraries and fundamental parameter databases as updates improve accuracy. Document analysis parameters, calibrations used, and any manual adjustments for full traceability and method validation.
Conclusion
XRF data analysis transforms raw spectroscopy measurements into precise quantitative elemental information through sophisticated processing algorithms and careful interpretation. Understanding the principles behind qualitative identification, quantitative methods like calibration curves and fundamental parameters, and the critical importance of matrix effect corrections enables analysts to extract maximum value from XRF measurements.
Modern software tools, both commercial and open-source, automate much of the complexity while providing flexibility for customization when needed. By following best practices in spectral processing, applying appropriate quality control measures, and understanding the statistical foundations of the results, analysts achieve reliable, accurate data that supports confident decision-making across applications from manufacturing quality control to geological exploration to environmental monitoring.
As XRF technology continues advancing with improved detectors, more powerful processing algorithms, and enhanced software capabilities, the ability to accurately process and interpret spectroscopy results remains fundamental to extracting meaningful insights from this powerful analytical technique.
Related posts
-
 XRF Analysis: Precise Metal Composition Testing
X-ray fluorescence (XRF) analysis has revolutionized metal composition testing across industries, offering...Einzelheiten
XRF Analysis: Precise Metal Composition Testing
X-ray fluorescence (XRF) analysis has revolutionized metal composition testing across industries, offering...Einzelheiten -
 XRF Analysis: Fast Material Composition Scanner
In today's fast-paced industrial environment, waiting days or weeks for laboratory results is no longer acceptable....Einzelheiten
XRF Analysis: Fast Material Composition Scanner
In today's fast-paced industrial environment, waiting days or weeks for laboratory results is no longer acceptable....Einzelheiten -
 XRF Analyzer: Accurate Element Identification
Accurate element identification forms the foundation of quality control, material verification, and compliance...Einzelheiten
XRF Analyzer: Accurate Element Identification
Accurate element identification forms the foundation of quality control, material verification, and compliance...Einzelheiten -
 XRF Fluorescence Analysis: Metals & Alloys Testing
X-ray fluorescence (XRF) analysis has transformed metals and alloys testing from a time-consuming laboratory process...Einzelheiten
XRF Fluorescence Analysis: Metals & Alloys Testing
X-ray fluorescence (XRF) analysis has transformed metals and alloys testing from a time-consuming laboratory process...Einzelheiten -
 XRF Testing: On-Site Metal Analysis Solutions
Traditional metal analysis required shipping samples to distant laboratories and waiting days or weeks for results....Einzelheiten
XRF Testing: On-Site Metal Analysis Solutions
Traditional metal analysis required shipping samples to distant laboratories and waiting days or weeks for results....Einzelheiten